Your Monday review, already written.
DemandRadar reads last week's actuals, finds the stores that drove the miss, and drafts the explanation your leadership will ask for, with the evidence behind every line. You edit it and send it.
Book a 20-minute conversation We're talking with 10 retail planning leaders to understand how this workflow works today.Keep your current planning stack. No replatforming required.
Sales finished 6.8% below plan. Produce drove nearly half the gap, concentrated in 17 stores.
At 9 of those stores, produce in-stock fell to 71% against a typical 96%. At another 6, heavy rain on Saturday cut store traffic by roughly a quarter during the peak afternoon hours.
Stores 118 and 131 sit next to the Route 9 lane closure that began Monday. Impact is likely temporary. Expect about three more weeks of softer traffic; adjusting orders now.
Explaining last week takes longer than it should.
The planning system tells you what happened. Someone on your team still has to figure out why, pull it together from five places, and write it up before Monday.
Today
"Why did Northeast Produce miss plan?"
- Thursday. Actuals land. The misses show up in the dashboard.
- Friday. Calls to stores and DCs. Was it a stockout, the weather, a promotion across the street?
- Sunday night. Excel, Power BI, emails and Teams threads become a narrative.
- Monday. Leadership asks a question the deck doesn't answer.
With DemandRadar
A first draft is waiting Monday morning.
Northeast Produce finished 8.7% below plan, accounting for 41% of the company miss. Shelves ran short at 11 stores. Severe weather softened traffic at 6 more.
Each cause comes with the stores and the evidence behind it. Your planner checks it, adjusts what they know better, and sends it up.
This is the product, not a mock-up.
Three screens carry the week: the review, what is coming next, and the scorecard that tells you whether to trust it.
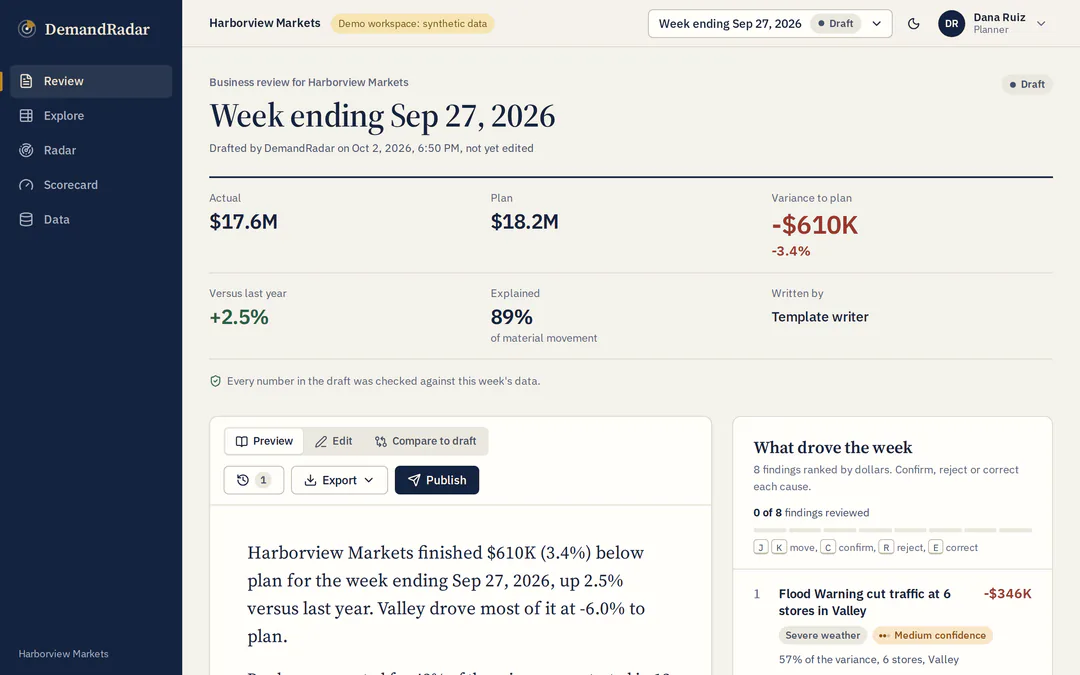
The review, drafted and sourced
Actual against plan, how much of the miss is explained, the written commentary, and each cause ranked by size with its stores and evidence. Your planner confirms, rejects or corrects every cause.
What it cannot explain, it says so. Nothing is forced onto a weak cause.
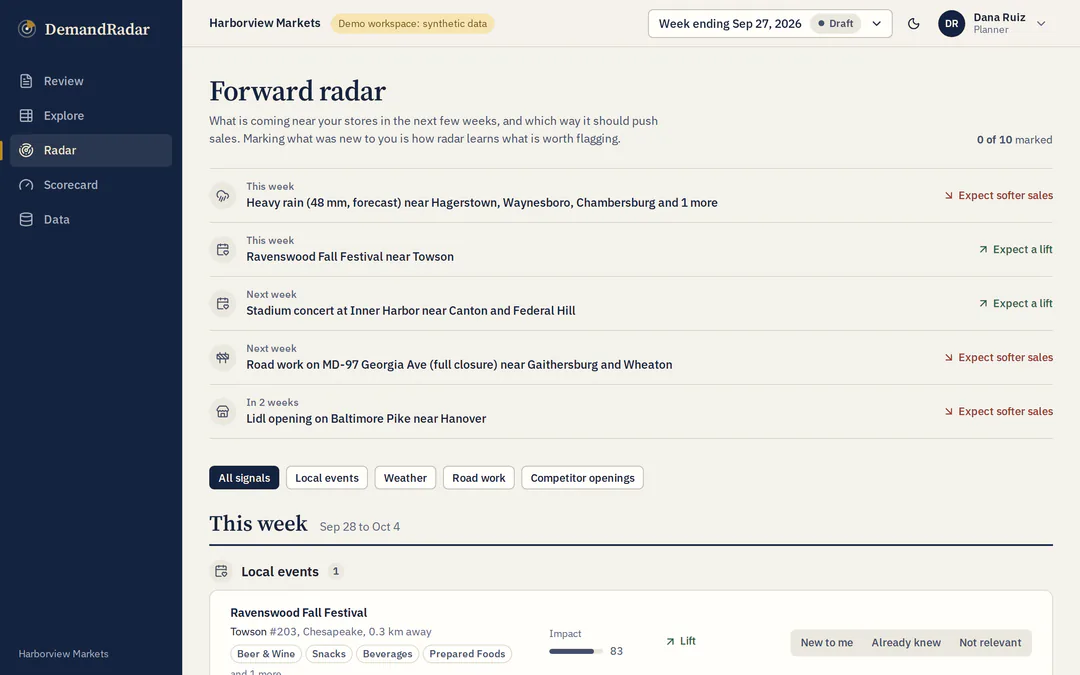
What is coming near your stores
Road work, large events, storms and competitor openings in the next three weeks, with the stores they touch and which way they should push sales.
Direction only. Each call is checked against what sales actually did.
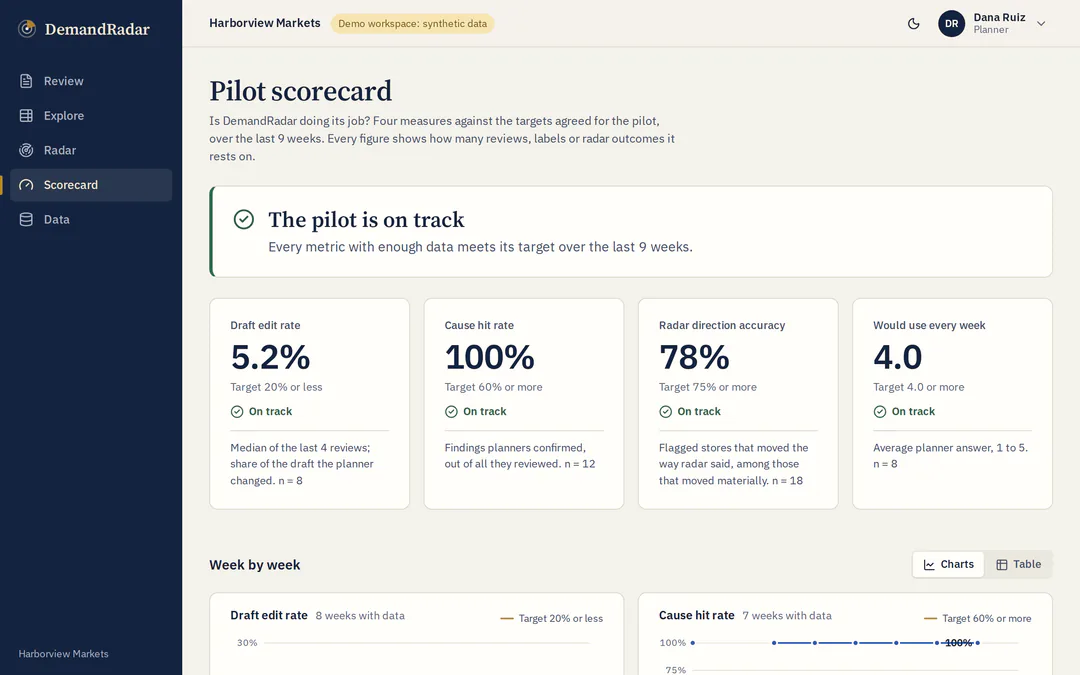
A scorecard on your own data
How much of the draft your planners changed, how many causes they confirmed, how often the radar pointed the right way, and whether they would use it every week.
Measured from what your team did, with sample sizes shown.
Screens show a demonstration retailer with synthetic data.
See next week's trouble before it shows up in sales.
DemandRadar watches what's changing around your stores: planned road work, local events, severe weather, and what your field team already knows. Your planners see it before it becomes another thing to investigate after the fact.
Forward radar
Example: week of October 5
- 8Road work starting near the storeLane closures published by the state DOT
- 3Large local events this weekendStadium game, county fair, and a 10K route
- 2Competitor opening nearbyLogged by your field team
- 14Severe weather riskNational Weather Service alerts for Friday and Saturday
It works with what you already have.
-
Send last week's numbers
Sales against plan by store, week and category, plus your store list. A CSV or Excel export is enough to start. In-stock rates make it sharper.
-
Get the draft Monday morning
The biggest misses, the stores behind them, the likely causes, and the evidence for each one.
-
Edit it and send it up
Change what you know better and confirm or correct each cause. Those answers sharpen the next draft.
Runs alongside your planning system. Whether you forecast in Blue Yonder, another platform, or a spreadsheet, DemandRadar sits on top and prepares the review.
You will know whether it works.
A pilot is judged on four numbers from your own weeks, set before it starts.
- 20%or less of the draft rewritten. Editing a few words means the draft is doing the work.
- 60%or more of causes confirmed by your planners.
- 75%or more radar calls pointing the right way once the week's sales are in.
- 4 of 5or higher when planners are asked if they would use it every week.
Built for your IT review.
The questions your security team will ask have answers.
- Runs in your cloud or ours. The same software either way.
- Weekly totals only. No transactions, shopper or SKU data required.
- Your sign-in. Single sign-on with roles, and a log of every change.
- Every number checked. A draft with a figure that does not trace to your data is discarded.
- AI writing is optional. Off by default; the built-in writer needs no outside service.
Read the security overview, including what is not in place yet.
We're talking to 10 regional retail planning teams.
If your team runs 50 to 500 stores and spends real hours each week explaining the numbers, we'd like to learn how you do it today. Twenty minutes, your process, your pain points. No demo unless you ask for one.
If there's a fit, founding planners get
- DemandRadar tested on four of your past weeks at no cost, compared against what your team actually wrote
- Free use through the pilot period
- A direct line to shape what gets built next